
As an NFL fan, (and a fan of the Seattle Seahawks in particular) I occasionally find myself watching football with my dad, and whenever I do, the accusation inevitably creeps in that the referees are biased in the way that they make penalty calls – specifically that for a given illegal action, a penalty flag will be thrown against the Seahawks much more frequently than against the opposing team, even when the offending action is performed at a similar rate by both teams. Personally, I’m not good enough at spotting every penalty on the field to say with confidence whether or not this is the case, and to be honest, my suspicion is that this feeling of one’s own team being unfairly persecuted is one harbored by most sports fans regardless of the team they root for. It occurs to me though, that as a data scientist, this sports fan is uniquely qualified to actually grab some data and attempt to vet this theory as it applies to my own team and be able to say with some objective numbers how well founded these suspicions may be.
The accusation at the heart of this study really has to do with penalties that are not called, for which there is no record, which makes this claim very hard to definitively confirm or refute. However, data on called penalties is published and publicly available, and through thoughtful analysis of the penalties that were called, we can at least see if there is any evidence of a bias towards calling penalties against certain teams more often than others.
Data
Detailed penalty data both by team and individual player spanning the current NFL season to as far back as the 2009 season is publicly viewable at nflpenalties.com, from which I constructed the bulk of the dataset used in tackling this issue. The data tracking individual players includes any player who incurred four or more penalties from 2009 through the 2018 season, and players flagged for any penalty in the 2019 season. While data on the playoffs of previous seasons was available, I only grabbed data from regular season games for consistency; if the post-season penalties where included, teams that consistently made it into the post season would have a higher number of penalties just by way of having played more games. For this reason I also omitted data from the 2020 season, which is still ongoing, and therefore incomplete. I supplemented this data by scouring the internet for head coaching records and merging this data into my records as well.
Analysis
The first thing to do is to compare the number of penalties that each team accrues across the league; if the Seahawks don’t rank high on the list, that’d be a pretty telling sign that there’s nothing to this theory. The Seahawks do rank high on the list of most penalized teams in the league at number five out of thirty two, however, this alone doesn’t mean that these high penalty numbers are unwarranted. The tricky thing to find here is evidence that the Seahawks high penalties numbers are due to some sort of bias rather than the alternate explanation that the team simply has a play or coaching style that is inherently less careful about adhering to the rules. So how does one find evidence that these penalties are not fairly called on account of a more careless play style of the team?
The answer is to look not at the team as a whole, but to look at the players individually; specifically players who have played on other teams within the league and have a record of penalties when playing for other teams as well as for Seattle. If examination of these numbers points to a trend of the same players receiving less penalties when playing on another team than when playing on Seattle, this could be strong evidence of an anti-Seattle bias. As with any statistical hypothesis testing, the presence of such a trend would not be proof of such a bias, but it would be evidence that there is reason to look into the issue further.
The following two histograms show the breakdown of average penalties called against this subset of players when they are playing for Seattle and when they are on other teams.
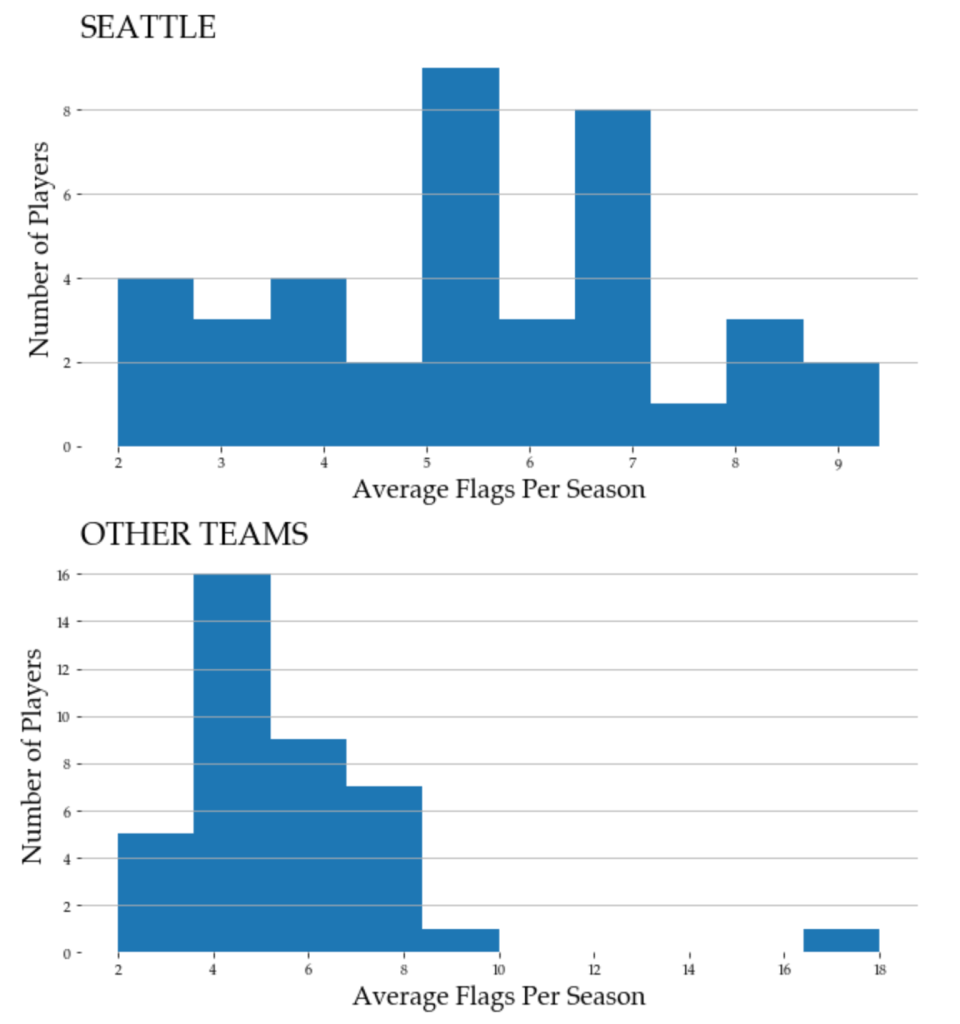
Of note is the statistical outlier on the bottom graph. This is Brandon Browner, whose accrued an average of 18 penalties per season when playing for other teams (and averaged 9 per season when playing for Seattle). When I include Browner in the analysis these numbers show that players who have a record with other teams as well as the Seahawks actually get called for more fowls per season when playing for other teams, but just barely. Average penalties for Seattle for these players is 5.4, vs 5.7 for other teams. If we exclude Browner from both categories, the remaining players do get more penalized when playing for Seattle, but just by a hair; there is practically no difference. A hypothesis test tells us that even the bigger difference when Browner is included between the average penalties when on and off of Seattle’s roster is not statistically significant, meaning that the difference between the two is likely due to random chance (which comes as no surprise given the small margin), but even at no difference between the two, there is no evidence here to suggest a systematic bias against Seattle. At this point I feel confident that my theory of fowl play can be put to rest, but I went on to look at a couple of other things as well, just for good measure.
Another exploration that can be done of the data available to shed light on the question is to attempt to get a sense for how much coaching effects the number of penalties accrued. I would expect that coaching would have some effect on penalty accrual as different coaches emphasize different priorities when managing their respective teams. Since coaches, like players, can move from team to team, we could reasonably expect to see changes in penalty trends when coaching staff changes. That is, if a highly penalized team’s coach moves to another team, the penalties would, to some extent, follow the coach and not stay with a team. If however the penalties tend to stay with the team and not follow the coach, this could be a sign that there may be some bias for or against certain teams in how penalties calls are made. Again this would not be a smoking gun, but rather a warning sign that further research is needed. If we had seen a big change in penalty numbers as players moved to or from teams other than Seattle, the amount of variation that we see caused by coaching changes would be something to compare such a difference against, but since the measured difference is inconsequentially small, this doesn’t end up being something to look at. If this study were repeated with different teams in the wild world of sports and different results were found, this would be another use for this part of the analysis.
It would be ideal to look at penalties under Seahawks coaches when they moved teams, however, as all but one year of available data has Pete Carroll as the head coach, and does not include Carroll coaching any other team in the league (he was coaching at the collegiate level prior to taking the job with Seattle), this isn’t possible. I have to settle for inferring conclusions from a more general look at coaching influence.
To address this issue, I look at a measure of the discrepancy in the number of penalties per season for organizational teams vs the same metric for all teams under a given head coach. For example the variation across all seasons for the Philadelphia Eagles vs variation across whichever team is coached by Andy Reid, which would include the Eagles for some seasons and the Kansas City Chiefs for others. If there is bias against teams present, we could expect to see lower discrepancies(a consistent number of penalty calls) from season to season for teams by location than for teams under given coaches.
What I found is that the deviation in seasonal penalties is lower across teams under the same head coach than teams by location. This difference is not large enough to be statistically significant however, the likelihood that the difference seen is just due to random variation rather than coaching having a significant impact on penalties is 77.8%. Again, histograms showing this comparison can be seen as in the graphic below.

The last analysis that I conducted to leave no stone unturned, is to check to see if there are connections between penalty calls and league finances. The critical look that I took at available data to make sure that there isn’t anything measurable to find here is to compare the number of penalties committed by each team to the amount of revenue that each team brings in for the NFL each year. If there were any sort of persistent bias present on account of the officiating team, the biggest motivation that I can think of for such a bias would be to boost ratings via making sure that the most popular teams get the best chance of making the playoffs and therefore the most play time. Given that the NFL brings in billions of dollars every year, this could be a big incentive to league ownership to maximize income. Since the teams around the league engage in a degree of profit sharing, such a practice may not even be detrimental to the less popular team’s finances, and therefore one could reasonably see a scenario in which less popular franchises wouldn’t have the incentive to look into this as one might think on the face of things. While yearly data is not publicly available for free of revenues by franchise, I was able to track down the numbers for the 2018 season thanks to an article published by Forbes. When I measure these figures agains the penalty counts for that year, I see practically no correlation between the two, which can be seen visually in the following scatter plot.

Conclusions
Okay, so after looking at these comparisons what can one actually say here? We’ve shown that players who have played on both Seattle and another team do not get targeted more frequently for penalty calls when wearing a Seattle jersey; if anything, the opposite in fact. This subgroup of players who have both experiences tend to have more penalty calls against them while wearing other team colors (although not in significantly big numbers to concretely say that there is a definitive trend). Furthermore when searching for evidence that coaching matters less than the team playing, a finding which could suggest bias against the team regardless of how they are being coached, once again we see weak evidence in the opposite direction, albeit statistically speaking, it’s kind of a wash. Lastly there is no evidence of financial incentives keeping penalties away from franchises that pull the biggest crowds.
Though it may be convenient or satisfying to point and yell at the refs when things go the wrong way for my team and demand to know why the guy in the other jersey wasn’t called for doing what looked like the same thing two plays earlier, the evidence to back it up with the available data just isn’t there.
For this study I used data from nflpenalties.com, Forbes, and wikipedia(for coaching records), the Python and SQL coding languages for analysis and AWS’ RDS for SQL Server database hosting.
For the reader who would like to see a slightly more technically in-depth version of this post along with samples of the code I used in my analysis, or the practice exercises that were born of it for helping job searchers stay up-to-date on their SQL query skills, these can be viewed in my GitHub repository for the study, here.
