With the start of a new year comes a new short term forecast for the U.S. economy (a little later than expected, but here none the less), with a few new visual depictions of my results as I start to experiment with Tableau’s data visualization software.
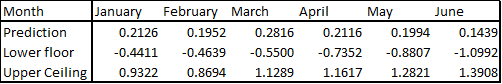
To get right to business, my models predict a rather slow and steady rate of GDP growth around 0.2% over the first few months of 2016 with a slight jump in March followed by a return to a rate of around 0.2% until June, where we could see some slowdown to around 0.14% To put this in perspective, if we were to see a 0.2% steady growth rate throughout the year, we would see yearly growth of close to 2.5%, compared to an average growth rate of around 3%, this is a little below average but not alarmingly so, and is a good sign given the fears of recession that have risen in the face of the recent shock to oil prices. My exact predictions for percentage growth of GDP along with the 95% confidence interval range can be viewed in the following table.
The following set of graphs outlines a breakdown of my forecast by categorical component of GDP in order to get a sense of what is the primary drivers are in the fluctuations that we can expect to see. The top graph shows the percentage change of the different components that I’ve broken GDP into and the bottom figure shows the breakdown of GDP by the various components for both my forecast and in recent history to provide some historical context.
https://public.tableau.com/javascripts/api/viz_v1.js
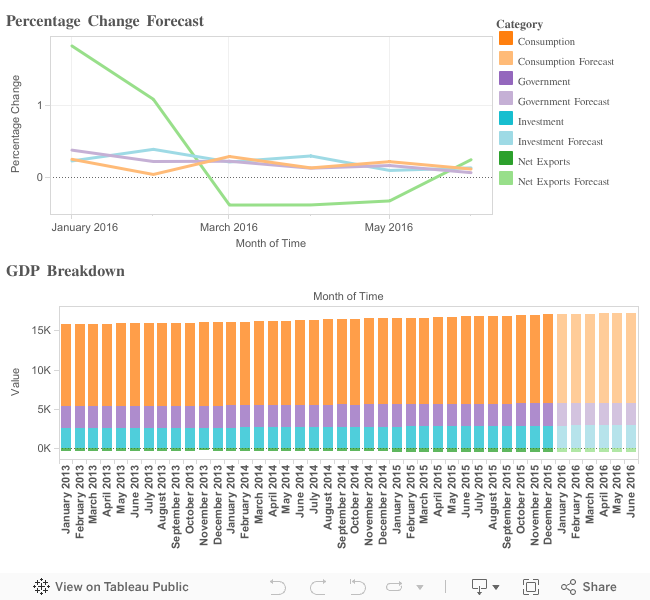
As I’ve discussed in my previous posts regarding my economic growth predictions I generate my estimates by taking a weighted average of the output of two separate forecasting models that I have developed, and then correcting the interval estimates for calibration (so that the 95% prediction range accurately captures the actual value 95% of the time). My estimates for this breakdown by individual components are only generated using one of these two models, so the numbers generated by totaling them will be slightly different than my actual estimates, and slightly less accurate, but this still gives us an insightful look into how these individual components will change, and which ones will be most influential in the fluctuations of the overall economy. The biggest discrepancy between these rough estimates and my final predictions is in the month of March, where these estimates predict much lower growth than my final forecast, which seems to be due to a prediction of a decrease in net exports, as the other factors are estimated to retain steady growth of somewhere between 0.1% and 0.4%. Historically the percentage of change in net exports tends to be slightly lower in the second quarter of the year than the first, so this predicted negative rate of change starting in March wouldn’t necessarily be out of place, and if GDP growth does fall short of my predictions in that month, lower net exports will likely be the culprit.
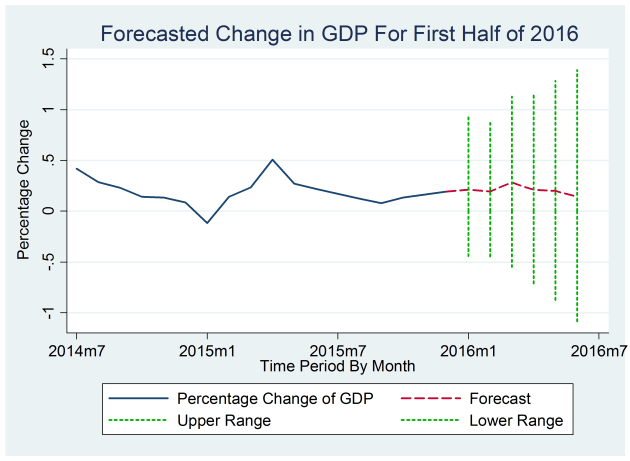
Lastly I have included a graphical look at my predictions for the change as a whole which includes a graphical representation of the 95% interval forecast as well as the point forecast.
One advantage of being a little bit late in publishing these predictions is that by this point early figures for the actual GDP measured in January have been released, and encouragingly, the early estimate comes very close to the amount that I have predicted. My model predicts the value for GDP as $16,533 billion as opposed to $16,532 billion as reported by the U.S. government, which though off by a billion is still encouragingly close given that billions are the units of measure that I’m working with.
Lastly, one other piece of the overall picture of the U.S. economy that my models provide is the change in national unemployment. According to my model unemployment should fall (more people will have jobs) by around 1% January through April, and then increase slightly in May and decrease by less than a percent in June. While unemployment can be a useful gauge of economic health, I include it here as a footnote rather than a central piece of my forecast because I am not as confident in this prediction as I am in that of GDP. It is included with the output of my model, but I have not yet done diagnostic/validation testing to ensure its historic accuracy since this measure has never been the central focus of my model. All that to say, take this last bit of info with a grain of salt.
