This week I have decided to tackle a less regional issue in favor of something with a little more widespread applications – specifically the U.S. economy as a whole. I am taking a look at the direction that the U.S. economy is headed in in the near future. The primary way that any nations economy is measured is by its gross domestic product. Gross domestic product is formulated by adding up the total value of all of the nations goods and services produced within the given measurement period – it encompasses the entire economic output of a nation, and this is what makes it such a useful way to check a nations economic pulse. So when you want to know what the economy is doing, this is where to look.
What’s happening in the overall economy can be extremely important to take into account when making business or really any sort of financial decisions, but arguably more important than knowing where the economy is at this exact moment is where it will be; knowing where you are can give you a baseline, but to really plan for the future you have to have some idea of where you are going. This is why forecasting gross domestic product is just as vital for business decision makers as forecasting the weather is for pilots or sailors – the economy is the weather that a business must navigate through to get to wherever it needs to go. That is why this week I have devoted my attention to forecasting the growth of U.S. GDP for the next half year. I have chosen to report my forecast in change in GDP rather than the exact amount because I feel that this is a more useful measurement. If I tell you that GDP is going to be around 16,502 billion dollars in July, that requires a lot more context to interpret than if I tell you how much growth we can expect to see.
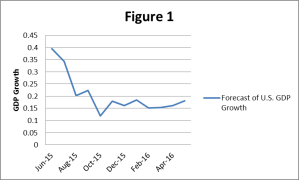
Before I get into my methodology let me just jump into my prediction up front, then I’ll discuss where exactly these figures are coming from. My prediction is that U.S. GDP is going to grow by 0.94% in the third quarter of 2015 and an additional 0.46% in the fourth quarter of 2015. I predict that growth will start out high at well over 0.3% in June and July and then slow down to closer to 0.2% for the rest of the summer. Growth may dip to around 0.12% around October and then bounce back to a steady rate of around 0.15 in the months after that. Most of the this variation in growth rate is due to expected changes in net exports. Consumption spending, government spending, and investment spending can be expected to fluctuate some, but most of the high growth in the beginning of the summer is due to either a larger than average expected amount of exports, or much fewer imports than normal. If this abnormal imbalance of exports and imports doesn’t actually occur, we can expect June and July growth to be more in line with the rest of the summer at around 0.2%.
Just to give a little bit of context, since the end of world war two or so, our economy has grown by a little over 3% annually on average. So this level of growth is a little bit below average at an annual rate of 2.45% but it’s certainly not unusual, and it will be the highest annual growth seen since the Great Recession. Last year’s growth was the highest since the recession so far at 2.4%.
Now that that’s out of the way and available for results oriented readers, lets talk about how I got to those numbers. There are two main ways to forecast GDP; you can either try to look at GDP as a single variable and predict that variable, or you can attempt to forecast the individual parts of GDP and then add them together to form your prediction. I have used both methods, which yield similar but not identical results. I have built one model to predict GDP as a whole, and another which predicts consumer spending, government spending, national investment, and net exports and then uses these estimates to predict GDP. I decided to use a weighted average of the outputs of these models to form my forecast, I weight one prediction less heavily than the other because it does a poorer job of explaining past GDP.
In order to benchmark my work I have looked at a GDP forecast published by the U.S. government. By comparing my results to those of someone who is paid to produce this forecast for a living I can get a feel for whether or not my forecast is roughly on the mark, or as on the mark as a prediction about an uncertain future can be. Basically I want to make sure I’m not deluding myself about my abilities as a forecaster. Another useful reason to look at these estimates is to use them to adjust my forecast. It has been found in forecasting, both in the field of economics and others, that generally the most accurate forecast is not going to be one created by any one professional but by averaging the forecasts put forth by the various professionals within a field. Because I have no reason to think that my forecast is better than that created by the U.S. government itself, it stands to reason that by averaging my results with those published by the government my prediction should become more accurate. Since accuracy is my goal this is exactly what I have decided to do. I am told that this practice is similar to that of weather forecasters; when private weather companies need to forecast the weather they use the government’s publicly available results published on weather.gov as a benchmark or jumping off point to formulate their predictions.
What I find when I compare my results to those of the government economist is that they are not too far apart, and that there are striking similarities in the trend which are apparent when I graph both predictions as lines. One point of interest is that while the lines seem to have similar contours to one another, my forecasts predict these upswings and downswings as consistently happening a month in advance of when the government predicts them.

The weighted average of my model’s results compared to those provided by the U.S. government
This is a result that I seem to remember also being the case when I initially attempted to create a GDP forecast for a term paper back in graduate school. While I am not certain why this is, I choose to defer to the opinion of the expert forecasters employed by the U.S. government for now as they have much more experience in this endeavor than I, and therefore in creating my final product I choose to average a one month lag of my two predictions with the predictions put forward by the U.S. economist. Whether or not this ends up actually making my forecast more accurate is something that I intend to find out in the future.
Forecasting is not a static process that once completed is never looked at again, but an ongoing process that is subject to revision and update. In the coming months I will be taking a look at the accuracy of my results and which assumptions help improve my methods and which can be set aside, as well as updating my predictions for the rest of 2015.
